|
WHICH MEASURES COUNT FOR THE PUBLIC INTEREST?
Not everything that counts can be counted, and not everything that can be counted counts. Attributed to Albert Einstein (from a sign on the wall in his office)
INTRODUCTION
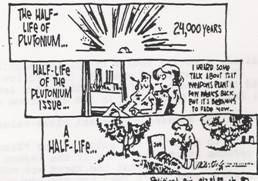
Figure 1. Political cartoon
Source: Reprinted with permission, Mike Keefe, The Denver Post.
I like to use this political cartoon to introduce the concept of measurement. Mathematically, it involves both an unfamiliar standard measure and non-standard measures. Also, because political cartoons involve non-linear and visual reading, this exercise reinforces the kind of careful attention to details, understanding what each symbol stands for, that is important in quantitative work. And, because understanding political cartoons often involves background knowledge of the particular political topic, it integrates interdisciplinary learning with mathematics. Further, this need for additional information gives the teacher a chance to underline how often, when people do not understand something, it is because they do not have the prior knowledge, not because they are “stupid;” this can free up students to ask more questions in class. In terms of the public interest, the lesson involves considerations of why most people are unaware of the meaning of the “half-life” measure, when in order to fully engage in debates about the safety of nuclear power and nuclear weapons, an understanding of this measure is crucial [1]. In terms of the public interest, a discussion about the accuracy and relevance of the non-standard measures is also important.
In this chapter, I’ll first discuss problems with measurement that happen when numbers are used to measure real situations which almost always contain important non-quantifiable aspects. Then I’ll present various attempts to create more complicated numerical measures that take into account non-standardizable aspects of our world. After discussing each issue, under the subheading “For Teachers,” I will include specific suggestions of quantitative and interdisciplinary aspects of that issue that can be used in math curricula. Finally, I’ll conclude with an argument for teaching about the complications of measuring in the real world.
1. INAPPROPRIATE MEASURES DO NOT SERVE THE PUBLIC INTEREST
The Yes Men are political performance artists. In their second documentary, The Yes Men Fix the World [2], they literally use a gold-painted skeleton, as a symbol for the kind of mathematical cost-benefit analysis practiced by most large globalized corporations. They used this prop in a talk they gave to bankers, posing as representatives of Dow, which among its many ethical crimes refuses to clean up their subsidiary Union Carbide’s 1984 industrial disaster in Bhopal, India. In their presentation, they introduced the “Acceptable Risk Calculator,” described on their satirical website (http://www.dowethics.com/risk/#ARC) as a measuring instrument created by Dow:
To safely predict the precise point at which profitability is threatened by danger to the public. Using our new Acceptable Risk Calculator, we weigh profits against costs in human life or health, thereby involving the public in the decision-making process about whom to put at risk, and where to locate risk globally (p. 1)
The Yes Men use satire to try to get their audiences to rebel against these kinds of cost-benefit measures, but instead, the bankers at the conference wanted the details of their cost-benefit calculator and their business cards[3]. And, when they visit various conservative think-tanks in Washington, D.C. to ask about Bhopal, they get answers which illustrate this same kind of cost-benefit thinking: “The Bhopal facility created educational opportunities for the people of Bhopal, and added value in terms of a tax base for the community, and 3000 people died. That’s a tragedy, but there are always risks going forward into the future…” (all in the same kind of matter-of-fact, slightly lower voice tone, when citing the very underestimated death toll) [4].
Henry Morley, in “Death’s Ciphering Book,” an 1855 article published in Charles Dickens’ magazine, Household Words, vigorously condemns such cost-benefit measures. In this case, he assails those who opposed a governmental regulation requiring manufacturers to protect workers from dangerous machinery because the number of accidents was very small compared to the total number of workers in England (about 1 accident for every 175 factory and mill workers; about 42 deaths for every 17,000 workers). He argues that “when the moral element is exchanged for the arithmetical” you could also calculate that, since there are relatively few murders and burglaries, why should people “be taxed for the maintenance of expensive systems of law and police” and why should the government “concern itself with such trifles?” (Cohen, 2005:150-152).
Unfortunately, this kind of measuring is still epidemic in the real world of global corporations. Economist Frank Ackerman and Law Professor Lisa Heinzerling (2004) report that when states were suing tobacco companies for medical expenditures resulting from cigarette smoking, W. Kip Viscusi, a professor of law and economics at Harvard, concluded that states, in fact, saved money as the result of their citizens’ smoking because they died early, saving the states healthcare expenses from an aging population! Viscusi even suggested that “cigarette smoking should be subsidized rather than taxed” (p.72).
In “Pricing the Priceless: Inside the Strange World of Cost-Benefit Analysis,” Heinzerling and Ackerman (2003) summarize the bankrupt nature of this kind of measure:
-
It puts dollar figures on values that are not commodities, and have no price. “If people are willing to pay $6.30 to avoid a one in a million increase in the risk of death, then the ‘value of a statistical life’ is $6.3 million.” (p. 16)
-
It ignores the collective choice presented to society by most public health and environmental problems. “Under the cost-benefit approach, valuation of environmental benefits is based on individuals’ private decisions as consumers or workers, not on their public values as citizens.” How much an individual would pay to clean up a major environmental disaster, for example, depends on others’ actions, since the clean-up can only happen if a gigantic amount of money is raised. (pp. 16-17)
-
It systematically downgrades the importance of the future. Costs and benefits of a policy frequently fall at different times. When the analysis spans a number of years, future costs and benefits are discounted, or treated as smaller amounts in today’s dollars. “At a discount rate of 5%, for example, the deaths of a billion people 500 years from now becomes less serious than the death of one person today.” (p. 20)
-
It ignores considerations of distribution and fairness. Cost-benefit analysis compares the total costs of a specific policy, to the total benefits, without considering who gets the benefits and who pays the costs. “Isn’t there an important difference between spending tax revenues, say, to improve the parks in rich communities, and spending the same revenues to clean up pollution in poor communities?” (p. 20)
1.1. For Teachers: The Mis-measurement of Labor
As many of the above examples illustrate, measures of labor costs are not often done with a concern to what benefits workers. The following table were compiled in time-and-motion studies, conducted by General Electric, and published in a 1960 handbook to provide office managers with standards by which clerical labor should be organized with scientific precision (Braverman, 1974:321) [5].
This example also involves considerable meaningful numeracy and is, unfortunately of current relevance to many adults entering the workplace. The underlying basic math skills related to measurements and the meaning of decimal fractions can be taught in such a way to provide an introduction to understanding calculations with percentages. In addition, the example illustrates the importance of understanding the meaning of the sizes of numbers that describe the world. Finally, all the quantitative topics and calculations I will describe are performed in order to gain more knowledge and a better analysis of the issue. The goal of the mathematics aspect of the lesson is not therefore merely to practice a particular math skill; the goal is to use relevant math skills to understand the pubic interest in the issue more clearly. And, of course, the hope is that understanding the issues of our world more clearly will help those who struggle to make more justice in the world.
Table 1. Time-and-motion studies
|
Open and close
|
Minutes
|
|
Open side
drawer of standard desk
|
0.014
|
|
Open center
drawer
|
0.026
|
|
Close side
drawer
|
0.015
|
|
Close center
drawer
|
0.027
|
|
Chair Activity
|
Minutes
|
|
Get up from
chair
|
0.039
|
|
Sit down in
chair
|
0.033
|
|
Turn in
swivel chair
|
0.009
|
Source: Elaborated by author.
I argue that it is important to present enough contexts about the subject matter in solving this problem with students, so that it is clear that studying the maths is an integral part of thinking about this specific public interest issue. Without this context, the real-life topic just serves as a ‘backdrop’ for doing the maths, and ignores the power of numeracy to clarify and deepen understanding of socio-political and economic issues. Further, without context, issues can become trivialized, and stereotypes and unstated assumptions about the ‘natural order of things,’ about ‘the way the world is,’ can become reinforced[6].
So, when I present the above chart I start by asking students to discuss what numerical understandings they need in order to understand the political and personal implications of the information. At first, students usually just start trying to do some kind of calculation, like changing the minutes into seconds, without thinking about the real-life situation. In discussion, we bring out that you don’t have to do that calculation in order to understand what it must be like to work where your activities are measured by thousandths of a minute. But, you do need to understand the meaning of decimal fractions, and you do need to understand that we do not generally measure time in thousandths of a minute, but rather our smallest common measure of time, the second, is a sixtieth of a minute.
We speculate about the politics of why the measures in the chart are presented in such non-intuitive units. And, we discuss how it makes sense to change the given measures into seconds to get a deeper understanding of the size of time allotted for these work tasks. We dialogue about why you multiply by 60:
Since the measures are in thousandths of a minute, that means the minute is divided into 1000 equal measures of time; and, if we want to express this in seconds, we have 60 seconds divided into 1000 equal measures of time, so that each measure is 60 ¸ 1000 = 0.06 seconds; and, if you are opening the side drawer of a standard desk, you are allotted 14 of these thousandths or 14 x 0.06 seconds = 0.84 seconds.
We discuss that the ‘shortcut’ is to multiply 0.014 by 60 (which is dividing 14 by 1000 first and then multiplying by 60), but the logic of the problem is to divide the 60 by 1000 first and then multiply by 14; and, the reason the ‘shortcut’ works is because if you are multiplying two numbers and dividing by a third number, you can perform those operations in any order [7].
But, the lesson does not just end with the calculations. For students to understand that this is not just an isolated chart, and to more deeply understand how and why numbers underpin worker control, we discuss historical examples. Braverman (1974) discusses the reasoning of William Henry Leffingwell, author of a text on the scientific management of office workers, who had:
calculated that the placement of water fountains so that each clerk walked, on the average, a mere hundred feet for a drink would cause the clerical workers in one office to walk and aggregate of fifty thousand miles each year just to drink an adequate amount of water, with a corresponding loss of time for the employer. (This represents the walking time of a thousand clerks, each of whom walked only a few hundred yards a day.)… All motions or energies not directed to the increase of capital are of course ‘wasted’ or ‘misspent.’ (p.310)
This presents an opportunity to verify these calculations, to calculate other aspects of contemporary work life from a Leffingwell perspective, and to discuss arguments about the use of those kinds of calculations, using knowledge of the meaning of the various measures. Amazingly, this kind of direct worker control is still going on in the USA and some is based on the same kinds of split-second vigilance that grew out of the 1960’s techniques. One of my students who work in the press room of the Boston Globe brought in a lengthy report commissioned by that newspaper (Ryan & Associates, 2001) that used a Time Measurement Unit, or TMU, for pressroom operations that is equal to 0.00001 hour. However, another student discussed a positive use of detailed management studies. Her employer produced a time-management report that was used to show more workers were needed to meet the company’s productivity goals [8].
Scharf (2003) gives non-numerical examples that supplement the quantitative monitoring of workers’ physical movements. In an attempt to completely separate mental from manual labor, employees in retail sales and restaurants are given scripts for all their interactions, and monitored by undercover “secret shoppers.” Drive-through window workers, for example, must greet customers within about “three seconds from the time the car reaches the menu board. Digital timers…measure how long it takes the worker to issue the greeting, take the order, and process the payment…. Former McDonald’s CEO Jack Greenberg claimed that unit sales increase 1% for every six seconds saved at the drive-through.” So, they cannot chat; but chains like Starbucks write employee scripts to sound not merely polite, but chatty and sincere. Employees are required to make small talk, as long as it isn’t about politics.
Scripts, especially ones like those at Starbucks are less visible means of control to consumers. The computerization of the workplace makes this control less visible to the workers, where secretaries and shop-floor workers can be monitored through special programs built into their computers. Robin (2002) gives an example related to the repression of union movements:
Exxon Mobil and Delta have installed a software program on their company computers to ferret out any sign of employee opposition to management authority. The program forwards to managers all employee documents and e-mails -saved or unsaved, sent or unsent- containing “alert” words like “boss” or “union.” As a supervisor explained to the Wall Street Journal, “The workplace is never free of fear -and shouldn’t be. Indeed, fear can be a powerful management tool” (p. D5).
Finally, Braverman (1974) discusses the theory behind “scientific” management, arguing how these kinds of measures work for a capitalist economic system that conceives of the worker as a general-purpose machine operated by management, displacing laborers as the subjective element of the labor process and transforming them into objects:
This mechanical exercise of human faculties according to motion types which are studied independently of the particular kind of work being done, brings to life the Marxist conception of ‘abstract labor.’… [The capitalist sees] labor not as a total human endeavor, but [abstracts it] from all its concrete qualities in order to comprehend it as universal and endlessly repeated motions, the sum of which, when merged with the other things that capital buys—machines, materials, etc.—results in the production of a larger sum of capital than that which was ‘invested’ at the outset of the process. Labor in the form of standardized motion patterns is labor used as an interchangeable part...(pp. 181-182)
I leave it up to the teacher readers to turn up myriad examples from how their own work has been monitored and circumscribed through standardized curriculum packets and other schooling practices.
1.2. For Teachers: The Mis-measurement of Intelligence
In addition to cost-benefit formulas, of which time-management calculations are an example, there are other kinds of measures that twist the picture of the situation being measured. These distorted measures work against the public interest by overly simplifying issues, so that solutions to problems those measures address do not benefit the public, and often benefit the private interests that developed the measures. One particularly important area, directly relevant to education, is the mis-measurement of intelligence. Stephen Jay Gould (1981), in his seminal work on the history of these measures shows, by recalculating findings from the original raw data, how ideology about who (racially) was intelligent, influenced which samples were included in the calculations of early nineteenth century researchers such as Samuel George Morton.
Thus Morton included a large subsample of small-brained people (Inca Peruvians) to pull down the Indian average, but excluded just as many Caucasian skulls to raise the mean of his own group. Since he tells us what he did so baldly, we must assume that Morton did not deem his procedure improper. But by what rationale did he keep Incas and exclude Hindus, unless it were the a priori assumption of a truly higher Caucasian mean?...If we restore all seventeen of Morton’s Hindu skulls... the Caucasian mean now drops to 84.45 cubic inches [in cranial capacity], for no difference worth mentioning between Indians and Caucasians. (Eskimos, despite Morton’s low opinion of them, yield a mean of 86.8, hidden by amalgamation with other subgroups in the Mongol grand mean of 83). So much for Indian inferiority (p.92).
When Gould recalculates all the tables
presented by Morton, from the original data that Morton included, his
“correction of Morton’s conventional ranking reveals no significant difference
among races” (p.99) [9]. Gould relates the switch from craniometry to Intelligence Quotient (IQ), and shows the bankruptcy of any single quantitative measure for “intelligence as a unitary, rankable, genetically based, and minimally alterable thing in the head” (p.36).
Unfortunately, this kind of inappropriate measure of intelligence is not just from the distant past. Gould (1995) demolishes the two major arguments underpinning Herrnstein and Murray’s notorious The Bell Curve (1994), a book whose major claim is that inherited intelligence is responsible for economic success [10]. A corollary of this claim is that white people’s inherited intelligence, not racism, is responsible for white people’s greater economic success[11]. Gould argues that Herrnstein and Murray’s argument that we have a meritocracy where the smart rise, rests on assumptions about a unitarily quantifiable, rankable, unchangeable, genetically inherited intelligence whose existence he disproved in The Mismeasure of Man. If even one of these premises is false, say immutability, “early intervention in education might work to boost IQ permanently, just as a pair of eyeglasses may correct a genetic defect in vision.” (p. 5) Gould argues against their second claim -that racial differences in IQ are mostly genetically determined- by exposing:
The central fallacy in using the substantial heritability of within-group IQ (among whites, for example) as an explanation of average differences between groups (whites versus blacks, for example)…Take a trait that is far more heritable than anyone has ever claimed IQ to be but is politically uncontroversial—body height. Suppose we measure the heights of adult males in a poor Indian village beset with nutritional deprivation, and suppose the average height of adult males is five feet six inches. Heritability within the village is high…[this] does not mean that better nutrition might not raise average height to five feet ten inches in a few generations. Similarly, the well-documented fifteen-point average difference in IQ between blacks and whites in America, with substantial heritability of IQ in family lines within each group, permits no automatic conclusion that truly equal opportunity might not raise the black average enough to equal or surpass the white mean (pp. 5-6)
[12].
And, further, Gould shows that g, the supposed unitary measure of intelligence found by factor analysis “cannot have inherent reality, for it emerges in one form of mathematical representation for correlations among tests and disappears (or greatly attenuates) in other forms, which are entirely equivalent in amount of information explained” (p. 9).
Just a glimpse of the startling examples
of misleading and incorrect uses of statistics in The Bell Curve, show extensive
possibilities for teaching statistics and research concepts. Gould (1995)
ferrets out an important measure, buried in the 100 pages of appendix, R², that
according to the authors is “the usual measure of goodness of fit for multiple
regressions.” Gould observes that Herrnstein and Murray’s generally low
correlation coefficients, the underpinnings of virtually all the numerical
arguments in the book, yield R² values (only reported in Appendix 4 which starts
on p. 593) of less than 0.1: “These very low values of R² expose the true
weakness, in any meaningful vernacular sense, of nearly all the relationships
that form the meat of The Bell Curve” (pp. 11-12). Kamin (1995) discusses the
problematic nature of the data in The Bell Curve by digging back into Herrnstein
and Murray’s references, and then tracing back those references to the original
studies. He details the incorrect reasoning involved in converting raw scores to
IQ’s in Herrnstein and Murray’s reference (Lynn) to African IQ’s. Of particular
interest to the politics of knowledge: one of Lynn’s references, a paper by
Owen, described by Lynn as “the best single study of Negroid intelligence,”
states that “the knowledge of English of the majority of black testers was so
poor” that some of the tests proved to be “virtually unusable”. In South Africa
the tests “assumed that the Zulu pupils were familiar with such things as
electrical appliances, microscopes and ‘Western types of ladies’ accessories’”
(p.83). Finally, Lynn ignored completely a report by another of his references
that “228 students in Soweto had an average of 45 correct responses…higher than
the mean of 44 achieved by the same-aged white sample on whom the test’s norms
had been established” (p.85) [13].
Gould (1996) identifies:
The operative paragraph of The Mismeasure of Man: We pass through this world but once. Few tragedies can be more extensive than the stunting of life, few injustices deeper than the denial of an opportunity to strive or even to hope, by a limit imposed from without, but falsely identified as lying within (p. 50) [14].
2. CREATING MORE APPROPRIATE MEASURES TO SERVE THE PUBLIC INTEREST
When Fidel Castro wanted to make a dramatic point about the impact of imperialism on Latin America in his Second Declaration Of Havana, (Halperin, 1975), he not only created a non-standard measure, but also decided to state the intermediate calculations. His argument, therefore, becomes a gradual clarity of the impact of imperialism, the more calculations, the more clear it is for us to grasp the meaning of the numbers, a quantitative poetry of pain:
What this nightmare in Latin America adds up to is that this continent of almost 200 million human beings, two-thirds of whom are Indians, Mestizos and Negros, the discriminated races of this continent of semi-colonies, the death rate from hunger, curable diseases, and premature old age amounts to approximately four persons per minute, 5,500 per day, 2 million per year, 10 million every five years. . . . Meanwhile an unending torrent of money flows from Latin America to the United States: some $4,000 per minute, $5 million per day, $2 billion per year, $10 billion every five years. For each thousand dollars they take from us, they leave us a corpse. A thousand dollars per corpse: that is a price that is imperialism! $1000 per corpse, four times per minute!
When I use this example with adult numeracy students, I start by asking them what the argument is, what background information they would need to understand the argument, and what background information they would need to decide if they agreed with the argument. Then, we focus on the numbers, first doing the calculations, which gives us an opportunity to review calculating with large numbers, as well as the uses of multiplication and division. But, we also discuss the power of Castro’s presentation: is including all the steps of the calculations important to his argument? Why or why not? Is there a different way to express these same numbers that would be more powerful? Are there other types of data that would have added more power to his argument? Is more than quantifiable data needed to measure the consequences of imperialism?
In addition to Fidel Castro’s new measure, and Matt Weurker’s, there are many real examples where complicated formulas have been developed to quantify complicated situations (figure 2). For example, in order to counter the myth that countries with giant populations are causing our planet’s environmental problems, Wackernagel, Onisto, et.al. developed the “ecological footprint” which measures the biologically productive areas necessary to continuously provide resource supplies and absorb wastes, using prevailing technology in particular communities. In 2006, India’s ecological footprint was 0.8 hectares per person (ha/cap) and China’s was 1.8 ha/cap, in contrast to Belgium’s footprint of 5.7 ha/cap, England’s of 6.1 ha/cap, and our country’s 9.0 ha/cap.
Returning to the questions raised by Fidel Castro’s measured denunciation of imperialism, the detailed example for teachers that follows focuses on a situation which involves quite complicated research questions, including considerations about the limitations of relying solely on numerical measures.
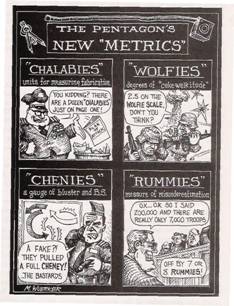
Figure 2. Reprinted with permission, Matt Weurker
Source: Politico.com.
2.1. For Teachers: Appropriate Measurement of Tax Fairness
Taxes are connected to so many public interest issues, and yet, in so much popular discourse about tax policies, both the facts and the philosophical debates are twisted, and replaced by irrational anger. A very powerful illustration of this came out a few summers ago when the Boston Globe (Saulny & Davey, 2009) reported that the former wife of the man who killed Dr. George Tiller, the Kansas doctor who performed late-term abortions at his clinic, recalled that her ex-husband “seemed to undergo a drastic personality shift more than a decade ago…. ‘He wanted a scapegoat,’ she said. ‘First it was taxes, he stopped paying, then he turned to the church and got involved in antiabortion” (p. A6).
Even the way we talk about tax policies is distorted. The public sector in our country has repeatedly faced budget cuts and under-funding as a result of what has been almost universally called a “fiscal crisis”. That phrase is not neutral; that phrase frames the issue in a way that promotes a view that there is a scarcity of economic resources; that phrase does not interrogate our current public revenue possibilities (i.e., our tax structure). Instead, the public interest issue could be framed as a “social justice crisis,” furthering the view that the problem does not focus on scarcity, but rather on the distribution of economic resources.
A quantitative reasoning exercise that my students have great difficulty with, involves countering arguments about measures of tax fairness: economic conservatives, for example, argue that it is unfair for the top 1 percent income group of households to pay a very disproportionate share of all federal income taxes (in 1997, as indicated in Frank’s (2002) chart below, they paid 33.6%). Partly, I think, confusions about the meaning of percents prevents them from seeing that, of course, those with super-large incomes would pay a larger portion of total tax revenues, reflecting their disproportionate share of total income [15]. Also, since each column on the chart represents percents of different totals, it is a good opportunity to review the meaning of percents. Initially, for example, some of my students think that, as in the last column, the percents are all calculated as a portion of the average household income.
Table 2. Distribution of Income and Taxes by Income Groups, year 1997
|
Income
Group
|
Average
Household Income
|
Share
of Pre-Tax Income
|
Share
of Federal Income Taxes
|
Share
of After-Tax Income
|
Share
of All Federal Taxes
|
Effective
State and Local Tax Rate (1995)
|
|
Lowest 20%
|
$11,400
|
4.0%
|
-2.0%
|
4.8%
|
0.9%
|
12.4%
|
|
Second 20%
|
$28,600
|
9.0%
|
1.1%
|
10.1%
|
5.2%
|
10.3%
|
|
Third 20%
|
$45,500
|
13.9%
|
6.4%
|
14.9%
|
10.4%
|
9.4%
|
|
Fourth 20%
|
$65,600
|
20.2%
|
14.5%
|
20.8%
|
18.1%
|
8.6%
|
|
Top 20%
|
$167,500
|
53.2%
|
80.0%
|
49.7%
|
65.4%
|
7.0%
|
|
Top 10%
|
$240,700
|
38.7%
|
65.4%
|
35.3%
|
50.4%
|
n.a.
|
|
Top 5%
|
$355,800
|
28.9%
|
53.8%
|
25.8%
|
39.4%
|
n.a.
|
|
Top 1%
|
$1,016,000
|
15.8%
|
33.6%
|
13.7%
|
23.1%
|
5.8%
|
Source: Chart from Frank (2002). Congressional Budget Office, Effective Tax Rates, 1979-1997; Citizens for Tax Justice, Who Pays? A Distributional Analysis of the Tax Systems in All 50 States, 1995 (last column).
But, in addition to many students having only rote knowledge of percents (i.e., how to solve formulaic percent problems), much mathematics education avoids dealing with complicated issues, especially if those issues involve more than just “naked” mathematical calculations and concepts. Because of this narrow approach to mathematics curricula, most students will not be familiar with reasoning such as in Frank’s counter-argument that the more appropriate measures to examine concerning tax fairness are the before and after tax share of total income. The top 1% income group paid a disproportionate share of the total federal income taxes, but, after paying those taxes, they still retained their disproportionate share of the total income (before taxes: 15.8%; after taxes: 13.7%). In other words, the federal income tax system is very slightly progressive (the bottom 20% income group went from a before-tax share of 4.0% to an after-tax share of 4.8%). Frank further argues that if one takes into account all the other taxes paid, the entire system is actually regressive. For example, clearly Social Security taxes (paid at the same rate by all, and, as of August 2011, only paid on the first $106,800 of income) take a much larger percent out of workers’ paychecks than out of wealthy people’s incomes[16]. And, labor economists believe that even the employer’s share of Social Security taxes hurts workers “since employers reduce wages to compensate for the tax instead of paying for it out of profits” (Frank, 2002). For another example, the chart shows that state and local taxes are quite regressive, with the bottom 20% income group paying 12.4% of their income in those taxes, as opposed to the top 1% paying 5.8% of their income. Frank hypothesizes that adding all these taxes together would “almost certainly find that the U. S. tax system, as a whole, is not progressive at all” (p.44) [17]. Further, Rabson (2002) adds that the rich benefit more from public spending than the poor. “An employer profits from the public education of his employees, from the roads his trucks drive on, from the air traffic subsidized by the FAA [Federal Aviation Administration], from the health of his employees, maintained by public health services…” [18]
Broader measures of tax fairness would include measures throughout the entire tax structure. For example, does describing the middle-class tax help with housing as a “homeowner’s tax deduction,” and the poor people’s tax help with housing a “housing subsidy” influence people to support the former and view the latter as a hand-out for the lazy? Would people be surprised to know that in 1981, for example, the housing subsidy for homeowner's real estate taxes and mortgage interest was greater than the money the government had spent in all its housing programs for low-income families since 1937. The arc has not bent towards more justice -according to housing activist and scholar Michael Stone (2009), in 2006, total housing tax expenditures (for homeowners and investors) were about $150 billion versus housing subsidies (for people with low enough incomes to qualify) of about $39 billion; and, if we use the same words to describe all government spending on housing, the top quintile received about three times what the bottom quintile got ($94.3 billion versus $34.3 billion) [19]. Finally, because tax advantages like the homeowners deduction are based on assets, they disproportionately benefit those who already have assets. So, for example, as Oliver and Shapiro (1997) state in their seminal study of the effect of wealth on racial inequality, “the seemingly race-neutral tax code thus generates a racial effect that deepens rather than equalizes the economic gulf between blacks and whites” (p. 43).
Underlying these measures of tax fairness are other factors important to consider in public interest decisions about these measures, factors that are often omitted from the public dialogue, and even from public perceptions of the measures. In the examples of the previous section, I discussed various critiques, which can be summarized as saying that it is not appropriate to measure labor using quantitative measures of tiny amounts of time, and it is not possible to measure intelligence using quantitative results of tests, whether tests of brain volume or written questions. Quantitative measures seem unimportant in these examples. On the other hand, in the measure of tax fairness, quantitative measures can help the debate about what is in the public interest. But, not alone; other considerations are equally important, and perhaps, even prior, to the quantitative measures.
How can we decide if a particular tax structure is fair without thinking about what our responsibilities are to each other, about what is means to live together in a society? As Frank (2002) states:
If one believes that Ken Lay deserved no less than the $100 million he collected from Enron last year, while the burger-flippers and office cleaners of America deserve no more than the $6.50 an hour they collect, then a progressive tax would seem immoral. But if one believes that incomes are determined by race, gender, connections, power, luck, and (occasionally) fraud, then redistribution through the tax system is a moral imperative (p. 44).
There are also economic considerations about “prior” ownership of economic resources, that range from how the European settlers initially became “owners” of the land through the genocide of the indigenous people [20], and how many got rich through the “free” labor of slaves [21], how later others got rich as “robber barons [22]” and through the continued enslavement of blacks [23], to those today who get wealthy from the exploitative conditions of their workers [24] and from the deregulation and depredations of our financial system, where profits are private and losses are socialized [25]. Underlying all these situations are issues about the control of our common inheritance of knowledge and technology and other economic resources. Alperovitz and Daly (2008) discuss studies by economists who “calculate that nearly 90 percent of productivity growth in the first half of the twentieth century is attributed to our collective ‘inheritance’ of knowledge and technology. Further, nearly 90 percent of our current GDP ‘was contributed by innovation carried out since 1870’” (p. 4). They argue that since the large part of our economic resources and products are in the public domain, “why, specifically, should this gift of our collective history not more generously and broadly benefit all members of society?” (p.5).
And there are even deeper philosophical questions about what ownership and what taxes actually mean: Murphy and Nagel (2002) argue against the notion that taxes are something that is taken away from what people already own -conservatives thinking that taxes are an impediment to encouraging creativity and economic development [26]; progressives thinking that taxes can be a fair way to fund human services that correct for the injustices created by capitalist economic development. Instead, they contend that:
… the idea of a prima facie property right in one’s pretax income —an income that could not exist without a tax-supported government— is meaningless. There is not reality, except as a bookkeeping figure, to the pretax income that each of us initially “has,” which the government must be equitable in taking from us. …The tax system… is among the conditions that create a set of property holdings, whose legitimacy can be assessed only by evaluating the justice of the whole system, taxes included (pp. 36-37).
…. [people] tend to think of taxes as an incursion by the government on a prior distribution of property and income by reference to which expropriation and redistribution has to be justified. That question has the form: “How much of what is mine should be taken from me to support public services or to be given to others? How much of what others possess should be taken from them and given to me?” Whereas we have been arguing that the right question is: “How should the tax system divide the social product between the private control of individuals and government control, and what factors should it cause or permit to determine who ends up with what?” (pp. 175-176).
So, a quantitative measure, even a very complex one, is not enough to evaluate tax fairness. Although quantitative information about the distribution of tax collection and the redistribution of tax revenue are an important part of making judgments about the fairness of tax policies, other questions must also be considered [27].
2.2. For Teachers: A Call for the Development of Appropriate Measurement of the Success of Educational Institutions
Five years ago, a time of particular struggle for my workplace, the College of Public and Community Service (University of Massachusetts/Boston), I sent a call to about 75 colleagues around the world for us to work on the development of new measures for the success of educational institutions. We were being judged solely by quantitative measures such as cost per student. This was unfair for a number of logical reasons, such as that one factor in our high cost per student was that we had not been allowed to hire new faculty for years, so our total salaries were higher than those of other colleges of the university. But, deeper than that, was the ‘race to the bottom’ of too many public universities, a race for larger and larger classes, with more and more low-paid contract faculty who cannot be as available to students since they have to rush around to many jobs to earn enough to survive. This is also a race for faculty to spend as little time with each student as possible so we can teach more; a race to churn out articles and do research that neatly translates into publishable articles and outside grant funds; and, a race to focus service inside the university (so there will be less need for hiring administrative staff).
Over the years a number of educators who have thought about issues of assessment, like the people at Fairtest (http://www.fairtest.org/resources/teacher), have been involved in both strong critique of particular aspects of educational measurement like standardized testing, and in disseminating more appropriate alternatives like portfolio evaluations [28]. But, to my knowledge, there have not been disseminated suggestions for more appropriate measures of the success of entire educational or other social justice institutions [29]. For example, is cost per student the appropriate measure to decide if a public university is successful? Instead, should we count the number of hours we spend teaching students in and outside of the classroom? Should we count how well we integrate community activism and classroom teaching? Should the quality of the faculty be judged collectively, not individual by individual, but by the sum total of the research and community teaching and other professional activity the entire institution contributes to the well-being of our community? Should the quality of our work be evaluated by how much our graduates are contributing to making our communities more just? [30]
We never got the international study group I called for underway, so this section is a call for educators to develop a new measure for evaluating the success of educational institutions —reflecting both a more collective philosophy that considers an educational institution more than the sum of its individual faculty’s and student’s achievements, and more than the computation of it’s economic bottom line; and, devising quantitative, as well as qualitative, ways of counting the contributions to social justice made by the institution over time.
3. IMPLICATIONS FOR TEACHING MEASURES TO SERVE THE PUBLIC INTEREST
Greer, Verschaffel, and Mukhopadhyay (2007:94) relate a discussion from the Mathematics Framework for California Public Schools (California Department of Education, 2000) that rules out a conceptual percent problem about tax fairness:
The 20 percent of California families with the lowest annual earnings pay an average of 14.1 percent in state and local taxes, and the middle 20 percent pay only 8.8 percent. What does that difference mean? Do you think it is fair? What additional questions do you have?
According to the California Department of Education, solving the problem would
…Require a strong background in politics, economics, and sociology…Moreover, the idea of ‘fairness’ is a difficult one even for professional political scientists and sociologists. Formulating a mathematical transcription of this elusive concept in this context is therefore beyond the grasp of the best professionals, much less that of school students. Since it is impossible to transcribe the problem into mathematics…this is therefore not a mathematical problem (p. 157) [31].
I am arguing for just the opposite —teaching mathematics in the public interest must involve interdisciplinary studies, must involve complex debates, and must involve tolerating complexity and ambiguity. Simplistic, overly clear mathematics problems about public interest issues work against the public interest by reinforcing a popular image that what can be measured by a mathematical calculation must be an accurate, thoughtful, and neutral description of the issue. Braverman (1974) comments on a presentation in a book about scientific time-management analysis for keyboard machines written in 1963:
It is worth noting that this simple list of three unit times, with their total, is made into a “table” by the addition of two useless lines and two useless columns. This is typical of the manner in which management “experts” dress their presentations in the trappings of mathematics in order to give them the appearance of ‘science’ (p. 324).
I have tried to show that in measuring the world, in the public interest, teachers should welcome multiple meanings, that mathematical measures should only be part of the considerations of public interest measures, that in some cases, like measuring labor efficiency in thousandths of a minute, mathematical measures should not count at all, and that in others, like measures of tax fairness, some mathematical measures can mislead and/or oversimplify issues. Ackerman and Heinzerling (2004) propose to not limit decision making about pubic interest issues to quantitative formulas:
Much of the information used in an atomistic analysis would also be relevant in what we call the holistic approach, where costs as a whole (usually monetary) and benefits as a whole (often largely non-monetary) are considered together —but are not forced to be expressed in the same units (p. 212).
Shaw and Miles (1979) recount that statistics developed from the material needs of society. In 1662 in England, Sir Willliam Petty published his Treatise of Taxes and Contributions.
For the use of demographic data in policy-making: thus one could calculate the levels of expenditure required for poor relief and devise an efficient taxation system…. It was only with the rise of industrial capitalism that statistical knowledge of society was widely developed (p. 31).
They further present a Marxist analysis of the need for quantification:
When labour, which produces goods, is itself bought and sold on the market like any other good, then all goods are measures in terms of the quantities of labour which are expressed in them. It is the relationship between wage -labour and capital- apparently a market relation although in fact a social relation of exploitation -which makes possible a universal money economy, in which everything can be expressed in comparable quantities and hence can be statistically rationalized (p. 35).
They hypothesize that in a socialist society, in Marx’s conception, where there would be more just social relationships, in the workplace and in all areas of life:
We would replace accountancy in terms of money and profit by accountancy in terms of social needs. We would replace the definition of social goals by those at the tops of the bureaucratic pyramids, by democratic self-control over all collective activities. We would then require new ways of measuring our needs and goals, which expressed their great variety rather than reduced them to money values or standards imposed from above (p. 36).
REFERENCES
Ackerman. F., & Heinzerling, L. (2004). Priceless: On knowing the price of everything and the value of nothing. New York: The New Press.
Alperovitz, G., & Daly, L. (2008). Unjust deserts: How the rich are taking our common inheritance and why we should take it back. New York: The New Press.
Bacon, J. (2002). Reparations and the media: A slanted arena for discussions of slavery recompense. Extra! 5, 21-22.
Baiochi, G. (2006). The citizens of Porto Alegre: In which Marco borrows bus fare and enters politics. Retrieved from
http://www.bostonreview.net/BR31.2/
Bernstein, J. (1995). The poop person’s guide to The Bell Curve. Scientific American, 4, 140.
Blackmon, D.A. (2008). Slavery by another name: The re-enslavement of Black Americans from the civil war to world War II. New York: Random House.
Bobo, K. (2009). Wage theft in America: Why millions of working Americans are not getting paid—and what we can do about it. New York: The New Press.
Boo, K. (2009). Letter from Mumbai: Opening night. The New Yorker, 2(23), 22-29.
Braverman, H. (1974). Labor and monopoly capital: The degradation of work in the twentieth century. New York: Monthly Review.
Burd-Sharpes, S., Lewis, K., & Martins, E. B. (2008). The Measure of America: American Human Development Report 2008-2009. New York: Columbia University Press.
Caldicott, H. (1997). The Cassini mission’s plutonium peril: NASA nuclear roulette. The Nation, 29-30.
California Department of Education (2000). Mathematics framework for California public schools: Kindergarten through Grade 12. Sacramento: Author.
Cohen, I.B. (2005). The triumph of numbers: How counting shaped modern life. New York: W.W. Norton & Company.
Collinge, A.M. (2009a). The student loan scam: The most oppressive debt in U.S. history—and how we can fight back. Boston, MA: Beacon.
Collinge, A.M. (2009b). Democracy Now! Retrieved from
http://www.democracynow.org/
Collins, C. & Pizzigati, S. (2008). Ike wanted to spread wealth, too: The wealthy of the Eisenhower years paid a hefty share of their income in taxes.
Progressive Media Project: Institute for Policy Studies.
Retrieved from
http://www.ips.dc.org/articles/863
Ehrenreich, B. (2001). Nickel and dimed: On (not) getting by in America. New York: Metropolitan Books.
Fadiman, A. (1998). The spirit catches you and you fall down: A Hmong child, her American doctors and the collision of two cultures. New York: Farrar, Straus and Giroux.
Feagin, J.R. (2004). Documenting the costs of slavery, segregation, and comtemporary racism: Why reparations are in order for African-Americans. Harvard Black Letter Law Journal, 20, 49-81.
Fox, M. (2009). Budgets by the people. In These Times, 8, 13-14.
Frank, E. (2002). Ask Dr. Dollar. Dollars & Sense, 7, 44.
Frankenstein, M. (2009). Using real real-life problems in teaching critical mathematical literacy. In L. Verschaffel, B. Greer, W. Van Dooren, & S. Mukhopadhyay (Eds.), Words and worlds: Modelling verbal descriptions of situations (pp. 87-98). Rotterdam: Sense Publications.
Friedman, J., Shapiro, I. & Greenstein, R. (2006). Recent tax and income trends among high-income taxpayers. Washington, D.C.: Center on Budget and Policy Priorities.
Gladwell, M. (2011). The order of things: what college rankings really tell us. The New Yorker, 2(14-21), 68-75.
Gould, S.J. (1981). The mismeasure of man. New York: W.W. Norton.
Gould, S.J. (1995). Mismeasure by any measure. In R. Jacoby & N. Glauberman, The Bell Curve Debate (pp. 3-13). New York: Random House.
Greenhouse, S. (2009). The big squeeze: Tough times for the American worker. New York: Anchor Books.
Greenstein, R., & Shapiro, I. (2003). The new, definitive CBO data on income and tax trends. Washington, D.C.: Center on Budget and Policy Priorities.
Greer, B., Verschaffel, L., & Mukhopadhyay, S. (2007). Modelling for life: Mathematics and children's experience. In W. Blum, P. Galbraith, H.W. Henn, & M. Niss (Eds.), Modelling and applications in mathematics education (pp. 89-98). New York: Springer.
Gutierrez, R. (2008). A ‘gap-gazing’ fetish in mathematics education? Problematizing research on the achievement gap. Journal for Research in Mathematics Education, 23, 357-364.
Halperin, M. (1975). The rise and decline of Fidel Castro. Los Angeles, CA: University of California Press.
Heinzerling, L., & Ackerman, F. (2003). Pricing the priceless: Inside the strange world of cost-benefit analysis. Dollars & Sense, 3, 23-34.
Hilgart, A. (1994). The U. Q. test for success. The Nation, 21, 614-623.
Hudgens, A.G. (1995). Bury my heart at Los Alamos. The Nation, 13, 210-213.
Jackson, D.Z. (2008). Chasing nuclear energy windmills. The Boston Globe, 6, 15-34.
Jackson, J. (2009). Interview, Democracy Now! Retrieved from
http://www.democracynow.org
Johnston, D.C. (2003). Perfectly legal: The covert campaign to rig our tax system to benefit the super rich-and cheat everybody else. New York: Penguin.
Johnston, D.C. (2007). Free lunch. New York: Penguin.
Kamin, L.J. (1995). Lies, damned lies, and statistics. In R. Jacoby & N. Glauberman, The bell curve debate (pp. 81-105). New York: Random House.
Lepore, J. (2009). Not so fast: Scientific management started as a way to work. How did it become a way of life? The New Yorker, 12, 114-122.
Lewis, J.E., DeGusta, D., Meyer, M.R. Monge, J.M. Mann, A.E., & Holloway, R.L. (2011). The Mismeasure of Science: Stephen Jay Gould versus Samuel George Morton on Skulls and Bias. Biology, 9(6), art 1.
Magdoff, F., & Yates, M.D. (2009). The ABCs of the economic crisis: What working people need to know. New York: Monthly Review Press.
Martin, D.B. (2009). Researching race in mathematics. Teachers College Record, 111(2), 295–338.
McNichol, E., Nicholas, A., & Shure, J. (2009). Raising state income taxes on high-income taxpayers. Washington, D.C.: Center on Budget and Policy Priorities.
Murphy, L., & Nagel, T. (2002). The myth of ownership: Taxes and justice. Oxford: Oxford University Press.
Naureckas, J. (1995). Racism resurgent: How media let The Bell Curve’s pseudo-science define the agenda on race. Retrieved from
http://www.fair.org/index.php?page=1271
Noah, T. (2008). McCain’s hero: More socialist than Obama! Retrieved from http://www.slate.com/
Oliver, M.L., & Shapiro, T.M. (1997). Black wealth/White wealth: A new perspective on racial inequality. New York: Routledge.
Prins, N. (2004). Other people’s money: The corporate mugging of America. New York: The New Press.
Rabson, G. (2002). Letter to the editor. Dollars & Sense, 13, art 6.
Robin, C. (2002). Lavatory and liberty: The secret history of the bathroom break. The Boston Globe, 29, 1-5.
Saulny, S., & Davey, M. (2009). Suspect in killing opposed abortion. The Boston Globe, 2, 6-23.
Scharf, A. (2003). From ‘Welcome to McDonalds’ to ‘Paper or Plastic?’ employers control the speech of service workers. Retrieved from
http://www.dollarsandsense.org/
Shaw, M., & Miles, I. (1979). Social statistics, towards a radical science. In J. Irvine, I. Miles & J. Evans (Eds.), Demystifying social statistics (pp. 27-38). London: Pluto.
Sherman, A., & Aron-Dine, A. (2007). New CBO data show income inequality continues to widen: After-tax-income for top 1 percent rose by $146,000 in 2004. Washington, D.C.: Center on Budget and Policy Priorities.
Stannard, D.E. (1992). Genocide in the Americas: Columbus’ legacy. The Nation, 19, 430-434.
Yates, M.D. (2007). Cheap motels and a hot plate: An economist’s travelogue. New York: Monthly Review Press.
Zinn, H. (1980). A people's history of the United States. New York: Harper & Row.
---------------
[1] Some other information that can be used looking at the mathematics of this measurement: different isotopes of plutonium have different half-lives, ranging from 20 minutes to 80 million years (http://www.nrc.gov/reading-rm/doc-collections/fact-sheets/plutonium.html); NASA’s Cassini Mission to Saturn, launched in October 1997, reaching Saturn June 2004 (http://www.solarviews.com/eng/cassinfs.htm, carried about 72 pounds of plutonium which powered the spacecraft “through natural radioactive deacy.” (http://saturn.jpl.nasa.gov/spacecraft/safety/power.pdf) and “Plutonium is so toxic that one pound distributed around the Earth in particles small enough to be inhaled could induce lung cancer in every person on the planet.” (Caldicott, 1997; see also The Institute for Energy and Environmental Research (http://www.ieer.org/ensec/no-3/puhealth.html). There is also information about the costs of our nuclear programs: Hudgens (1995) reviews a book about the disproportionate loss of lives of Native Americans, especially Navajo, uranium mine workers who were purposely not told about the dangers known by the governmental Atomic Energy Commission; Jackson (2008) gives dollar figures of about $96 billion to deal with the waste produced from nuclear power plants and the various taxpayer subsidies to this private industry (about $33 billion in recent years).
[2] I wrote a teacher resource guide for this movie which is on their website at:
http://theyesmenfixtheworld.com/teachers.htm
[3] In the documentary, an audience member comes up after this talk and recaps that the Risk-Assessor works out “the human impact opposed to how much money will be made,” and whichever way you calculate, you’ll “cause some loss of life.” Andy, the Yes Man impersonator, looks like he expects the man to criticize this immoral cost-benefit calculator, but as Andy attempts to defend the cost-benefit measure (“Do you find this…), the man interrupts: “I thought it was refreshing!”
[4] According to The Bhopal Medical Appeal (http://www.bhopal.org/) last visited November 20, 2009, “At least 8,000 people died within the first few days of the leak and, to date, a total of at least 25,000 have died as a result of the disaster”.
[5] There are, of course, many other such examples: reading a one-to three-digit number is supposed to take 0.005 minutes and a seven- to nine-digit number, 0.015 minutes; reading typed copy should take 0.008 minutes per inch; but, perhaps in a burst of empathy, scientific managers allow workers 0.01 minutes to write each numeral, as well as additional time to get and “release” a pencil or pen (Braverman, 1974, p. 321).
[6] For a more detailed discussion of creating real real-life problems see Frankenstein (2009).
[7] This math discussion can be extended to introduce a meaningful way of solving percent problems, first presented to me by my colleague Fadia Harik. The key is to always find 1%, which can be done, depending on the structure of the percent problem, by dividing by the given percent or dividing by 100. Then you multiply by the relevant percent to find what you are looking, for which, again depending on the structure of the problem, is either a given percent or 100.
[8] Interestingly, Lepore (2009) relates that Taylor and many of the other time-management gurus fudged much data. In one case, Taylor selectively picked men to observe “dared them to load sixteen and a half tons as fast as they could. They managed to do it in fourteen minutes; this yields a rate of seventy-one tons per man per ten-hour day. Taylor then inexplicably rounded up the number to seventy-five… [Then] he reduced seventy-five by about forty percent, claiming that this represented a work-to-rest ratio of the ‘law of heavy laboring’” (p.117). Loading this amount turned out to be an impossible task, but it did not prevent Taylor from billing the company what would be about $2.5 million in today’s dollars for two years of consulting work. And then the company fired him. Not surprisingly, Taylor’s attitudes towards the workers he was measuring with such a harsh yardstick were colored by racism—he believed they were stupid and Lepore says (p.116) he “made sure to underscore” that most of them were foreign. Surprisingly, a number of liberal intellectuals, like Louis Brandeis, felt that “scientific management would improve the lot of the little guy by raising wages, reducing the cost of goods, and elevating the standard of living.” Lepore quotes Brandeis: “Efficiency is the hope of democracy” (p.114).
[9] More recently, Northwestern University philosophy professor Charles Mills brought to my attention a critique of these measurements of Gould’s. Lewis, et. al., re-measure both Morton’s and Gould’s data and conclude that “Morton did not manipulate data to support his preconceptions, contra Gould. In fact, the Morton case provides an example of how the scientific method can shield results from cultural biases.” (p.1) The authors do not deny Morton’s racism; they focus, instead, on how science “relies on methods that limit the ability of the investigator’s admittedly inevitable biases to skew the results. Morton’s methods were sound, and our analysis shows that they prevented Morton’s biases from significantly impacting his results. The Morton case, rather than illustrating the ubiquity of bias, instead shows the ability of science to escape the bounds and blinders of cultural contexts.” (p.6) Unfortunately, because Gould is no longer alive, he was not able to respond to this critique. In any case, students can read Gould and Lewis, et. al., and investigate other commentaries on this issue.
[10] A brilliant satire on The Bell Curve talks of the U.Q. (the unscrupulousness quotient) effect developed from “longitudinal [genetic] studies of thousands of lives, using statistical techniques that hold constant such variables as environment, family status and measured I.Q. [which found that] life-time income correlates almost perfectly with U.Q.” (Hilgart, 1994, p. 614) Of course, as with many satires, the satire contains more truth than the reality. For another see Bernstein (1995).
[11] I think it is crucially important, when discussing “racial” differences, in this case, in measures of intelligence, to stress that race is a political category (created as a corollary to racism), but that there are no significant genetic differences among human beings. Gould (1996): “Obviously, we cannot make a coherent claim for “blacks” being innately anything by heredity if the people so categorized do not form a distinctive genealogical grouping… as more and more genes are sequenced and analyzed for their variation among human racial groups, and as we reconstruct genealogical trees based upon these genetic differences, the same strong signal and pattern seem to be emerging: Homo Sapiens arose in Africa; the migration into the rest of the world did not begin until 112,000 to 280,000 years ago, with the latest, more technologically sophisticated studies favoring dates near the younger end of this spectrum. In other words, all non-African racial diversity… may not be much older than one hundred thousand years. By contrast Homo Sapiens has lived in Africa for a longer time. Consequently, since genetic diversity correlates with time available for evolutionary change, genetic variety among Africans alone exceeds the sum total of genetic diversity for everyone else in the rest of the world combined! How, therefore, can we lump “African blacks” together as a single group, and imbue them with traits either favorable or unfavorable, when they represent more evolutionary space and more genetic variety than we find in all non-African people in all the rest of the world? (pp. 398-399) See also
http://www.pbs.org/race/000_General/000_00-Home.htm an online packet of resources for California Newsreel’s 3-part documentary Race—The Power of an Illusion, and “Is Race Real”?
http://raceandgenomics.ssrc.org/Lewontin/, a web forum organized by the Social Sciences Research Council.
[12] And Gould (1995) cites evidence of just that, such as “failure to find any cognitive differences between two cohorts of children born out of wedlock to German women, raised in Germany as Germans, but fathered by black and white American soldiers” (p.7).
[13] The media reaction to the completely discredited arguments about racial differences regurgitated in The Bell Curve is part of the picture that should be reviewed in teaching about mis-measurement. Naureckas (1995) recounts how in the “respectable” media, from The MacNeil/Lehrer News Hour to Charlie Rose and the New Republic to the covers of Newsweek and the New York Times Magazine, racism was treated as a “respectable intellectual position.” Newsweek, for example: "As the shouting begins, it's worth noting that the science behind The Bell Curve is overwhelmingly mainstream." Omitted from focus was the major funding source of Murray and Herrnstein’s “research” —the Pioneer Fund, established “in 1937 by Wickliffe Draper, a millionaire who advocated sending blacks back to Africa,” and whose first president, Harry Laughlin, was “an influential advocate of sterilization for those he considered genetically unfit.” Also, missing from media accounts, was information about Lynn, cited by Murray and Herrnstein as “a leading scholar of racial and ethnic differences,” whose work was eviscerated by Kamin as mentioned in this chapter. Naureckas gives a peek at “Lynn’s thinking on such differences: ‘What is called for here is not genocide, the killing off of the population of incompetent cultures. But we do need to think realistically in terms of the 'phasing out' of such peoples.... Evolutionary progress means the extinction of the less competent. To think otherwise is mere sentimentality.’ (cited in Newsday, 11/9/94)” Naureckas further points out that the fact that The Bell Curve supported the conservative agenda concerning immigration and restriction of welfare spending (for the poor) was noted in the book’s initial proposal: "a huge number of well-meaning whites fear that they are closet racists, and this book tells them they are not. It's going to make them feel better about things they already think but do not know how to say (New York Times Magazine, 10/9/94)”.
[14] It would also be important to discuss with teachers concerns about the problematic focus on the measure of “the racial achievement gap.” Martin (2009) argues: “Just as race is socially constructed, I claim that achievement differences and “racial gaps” are also socially constructed and contingent. They are not real in the sense that they tell us anything factual, objective, or indisputable about African American, Latino, Native American, Asian American, or White children. What these so-called gaps do highlight are the adverse conditions under which some children are often forced to learn, the privileged conditions afforded to others, and how forces like racism are used to position students in a racial hierarchy.” (p.6) Gutierrez (2008) discuses the dangers about focusing research on the “racial achievement gap,” including: “offering little more than a static picture of inequities, supporting deficit thinking and negative narratives about students of color and working-class students, perpetuating the myth that the problem (and therefore solution) is a technical one, and promoting a narrow definition of learning and equity.” Instead, she urges researchers to focus on “advancement (excellence and gains) and interventions for specific groups.” (abstract, p. 357).
[15] In 2004, the top 1% received 14.0% of national after-tax income while the middle 20% got 15%, and the bottom 20% earned 4.9%. (Sherman and Aron-Dine, 2007) In 2003, the top 20% received almost as much as the bottom 80%. (Friedman, Shapiro, and Greenstein, 2006).
[16] Further in 2000, the top 1% income group paid 36.5% of federal income taxes, but they paid only 4.3% of payroll —Social Security and Medicare— taxes. (Greenstein and Shapiro, 2003) Most workers pay more payroll taxes than income taxes—in 2000, the figure was more than 75% of workers. “The CBO estimates that in 2006, individual income taxes will represent 43 percent of all federal taxes, and payroll taxes will represent 36 percent.”(Friedman, Shapiro, and Greenstein, 2006).
[17] There are many basic mathematical problems that arise from thinking about issues of tax fairness, including calculations to show how flat taxes are regressive, why the payroll tax is regressive, and how progressive tax structures actually work (i.e., the increasing rates are calculated only on the blocks of income to which they apply —the federal income tax increase Obama proposed in his campaign would have applied only to the amount of income greater than $250,000). Further, reading reports with data about taxes deepens understanding of how numbers can describe the world, and how different calculations can change the picture. See, for example (McNichol, Nicholas and Shure, 2009) which explains some of their calculations.
[18] To find tax information relevant to your community, The National Priorities Project is an accessible, user-friendly cite, compiling data about public and community issues:
www.nationalpriorities.org/
[19] Two books that provide information on so many more ways in which our tax structures transfer money from the poor and middle-class to ultra-wealthy individuals and corporations are: Johnston (2003), reviewed by Edward Herman in Z Magazine (http://www.zmag.org/zmag/viewArticle/13821); and Johnston (2007) discussed by Johnston with Bill Moyers (http://www.pbs.org/moyers/journal/01182008/watch.html).
[20] Columbus’ brutal treatment of the human beings he encountered in the Americas is a prime example. Looking for, but not finding much gold in Haiti, Columbus and his men sent slaves as the dividend they returned to Spain.
But too many slaves died in captivity. And so Columbus, desperate to pay back dividends to those who had invested, had to make good his promise to fill the ships with gold. In the province of Cicao on Haiti, where he and his men imagined huge gold fields to exist, they ordered all persons fourteen years or older to collect a certain quantity of gold every three months. When they brought it, they were given copper tokens to hang around their necks, Indians found without a copper token had their hands cut off and bled to death.
The Indians had been given an impossible task. The only gold around was bits of dust garnered from the streams. So they fled, were hunted down with dogs, and were killed.
Trying to put together an army of resistance, the Arawaks faced Spaniards who had armor muskets, swords, horses. When the Spaniards took prisoners they hanged them or burned them to death. Among the Arawaks, mass suicides began…In two years, through murder, mutilation, or suicide, half of the 250,000 Indians on Haiti were dead.…By the year 1515, there were perhaps fifty thousand Indians left. By 1550, there were five hundred. A report of the year 1650 shows none of the original Arawaks or their descendants left on the island. (Zinn, 1980, pp. 4-5).
Although there is great controversy about how many indigenous people were in the Americas at the time of the European invasion, it is clear to all that this was not “empty” land, and that the settlers committed a genocidal elimination of almost all the inhabitants: The number of people living North of Mexico prior to the European invasion remains a subject of much academic debate, with the most informed estimates ranging from a low of about 7 million to a high of 18 million. There is no doubt, however, that by the close of the nineteenth century the indigenous population of the United States and Canada totaled around 250,000. In sum, during the years separating the first arrival of Europeans in the sixteenth century and the infamous massacre at Wounded Knee in the winter of 1890, between 96 and 99 percent of North America’s native people were killed.” (Stannard, 1992, p. 431).
[21] Feagin (2004), arguing for reparations for slavery documents the vital role of slave labor in the capital accumulation that created our modern world: “perhaps the most important technological development of the eighteenth century, James Watt’s improved and successful steam engine, which greatly accelerated industrialization (for example, railroads and textile mills), was bankrolled by British investors with capital accumulated in the West Indies trade in slaves and slave-produced products. Without the often profitable enterprises around African and African American enslavement, it is unclear how or when the United States would have developed as a modern industrial nation.” (p. 52) Quantitatively, “Historical economist James Marketti estimates the dollar value of the labor taken from enslaved African Americans from 1790 to 1860 to be, depending on the historical assumptions, from $7 billion to as much as $40 billion. Such a figure roughly indicates what black individuals and families lost in income because they did not control their labor. Marketti suggests that, if that stolen income is multiplied by taking into account lost interest from then to the present, the current (1983) economic loss (income diverted) for black Americans ranges from $2.1 to $4.7 trillion” (p.53). Feagin calculates, adding studies of the economic effects of segregation and continued racial discrimination, that the total “worth of all that labor, taking into account lost interest over time and putting it in today’s dollars, is perhaps in the range of $5 to $24 trillion.” (p. 55).
For an account of how the media has treated the reparations issue, repeated false claims of opponents, while treating their ideas seriously and portraying proponents as vengeful and looking for easy money, see Bacon (2002,
http://www.fair.org/index.php?page=1110)
[22] Zinn (1980) shows how in the later years of the nineteenth century the explosive growth of capital, was accomplished by the industrial and political elites “with the aid of, and at the expense of black labor, white labor, Chinese labor, European immigrant labor, female labor, rewarding them differently by race, sex, national origin, and social class, in such a way as to create separate levels of oppression.” (p.247) For one example: the first transcontinental railroad was built from $200,000 of bribes “to get 9 million acres of free [my italics] land and $24 million in bonds, and paid $79 million, an overpayment of $36 million, to a construction company which really was its own. The construction was done by three thousand Irish and ten thousand Chinese, over a period of four years, working for one or two dollars a day…. There was a human cost to his exciting story of financial ingenuity. That year, records of the Interstate Commerce Commission showed that 22,000 railroad workers were killed or injured.” (p.248, 250)
[23] Blackmon (2008) tells the story of how “in the years after the Civil War, all of the Southern states passed this array of new laws, which were specifically designed to intimidate African Americans out of the political process, to inhibit their ability to have economic success, and eventually to force first thousands, and then eventually hundreds of thousands, of African Americans back into a form of involuntary servitude.” This happened because blacks, arrested for such “crimes” as being on the street, could not pay their way out of the jails and many factories or farm owners then used these unpaid prison laborers. “The workers… were starved, they were whipped, they were beaten. They didn’t receive medical care. Huge numbers of them died. Absolutely horrifying conditions that… were common to these forced labor camps that existed all over the South.” This system ended with World War II, mainly because of “propaganda vulnerabilities,” so our country could claim all our citizens had the freedoms we were fighting for. (Democracy Now! 2008,
http://www.democracynow.org/2008/7/11/slavery_by_another_name_ author_douglas)
[24] For just one example, not often mentioned in the myriad of references on workers lives: Bobo (2009) writes about how “Employers are stealing money from workers by cheating them of wages owed or not paying them at all.” (p. xi) and she quantifies this as billions of dollars a year, including wages stolen from workers at: 60 percent of nursing homes; 89 percent of non-monitored garment factories in Los Angeles and 67 percent of non-monitored garment factories in New York City; 25 percent of tomato producers, 35 percent of lettuce producers, 51 percent of cucumber producers, and 62 percent of garlic producers who hire farm workers; 78 percent of restaurants in New Orleans; almost half of day laborers, mainly focused on construction work; and, 100 percent of poultry plants. (p. 7) For more general information on contemporary exploitation of workers, including specific stories and analyses see Greenhouse (2009), Yates (2007) and Ehrenreich (2001).
[25] Magdoff and Yates (2009) present a clear analysis of why our capitalist economic system got us into our recent financial crisis, and why these crises will continue to happen unless we create a new economic system. And as a powerful illustration of how this system is connected world-wide, they (p.107) quote from an interview (Boo, 2009, p. 22) with a resident of a slum located on the property of an airport in Mumbai, India: “The banks in America went in a loss, then the scrap market in the slum areas came down, too.” Boo then relates: “A kilo of empty water bottles, once worth twenty-five rupees, was now worth ten. This is how the crisis was understood.” See Prins (2004) for a detailed description of “the corporate mugging of America” from someone who worked inside the financial empire. Although written before the recent crisis, Prins’ analysis of how deregulation, not the greed of a few individuals, leads to these crises, is very relevant to the current crisis. The last paragraph of her 2006 preface to the paperback edition, in essence, predicted the current crisis: “Though the merger business took a bath after the stock market bust, it was booming again, as were Wall Street compensations, by the end of 2004 and more so in 2005. Leading the record $2 trillion in new corporate consolidation were the usual suspects: the financial, energy and telecom industries, followed closely by the health care industry. It all proves that nothing erases the memory of fraud and conflicts of interest like a fresh round of cash to float on, and a Congress that refuses to dig beneath the surface.” (p.xiv) For a specific example of predatory behavior from the financial industry, one of particular relevance to students, see Collinge (2009a) about how student loan debt, ballooning when payments are late, is the most oppressive debt in our country since federally guaranteed student loans, and private loans, are not covered by any bankruptcy protections. And, because lenders also own collection companies, they make even more money when students default on their loans. (Collinge, 2009b; Jackson 2009) Magdoff and Yates (2009) start their last chapter with a quote from Harry Magdoff (1987):
There is no magic road out of the stagnation that has gripped the capitalist world. That being the case, what is needed is a redirection of priorities. Our real problems in America are not located in the stock market and other gambling casinos, but in what a large segment of the population faces every day: hunger, homelessness, inadequate health care, joblessness. For now, we need a new New Deal —one that includes Government-created jobs and income support for the poor. What is ultimately needed: a new social system, in which production is for use instead of for profits (p. 105).
[26] However, in our country’s history, there have been conservative politicians who felt it was fair to tax the wealthy at greater rates than the poor, working and middle classes: In 1910, Teddy Roosevelt stated: “We grudge no man a fortune in civil life if it is honorably obtained and well used. It is not even enough that it should have been gained without doing damage to the community. …The really big fortune, the swollen fortune, by the mere fact of its size, acquires qualities which differentiate it in kind as well as in degree from what is possessed by men of relatively small means. Therefore, I believe in a graduated income tax on big fortunes, and … a graduated inheritance tax on big fortunes, properly safeguarded against evasion, and increasing rapidly in amount with the size of the estate.” (quoted in Noah, 2008) In 1960, Eisenhower stated: “a few families are fabulously wealthy, contribute far less than they should in taxes, and are indifferent to the poverty of the great masses of the people. … a country in this situation is fraught with continual instability.” Under Eisenhower’s presidency, the U.S. taxed income over $3million (in 2008 dollars) at a rate of 91 percent. In spite of exploiting tax loopholes, in 1955 America’s 400 highest-income taxpayers averaged about $12 million in income and paid 51.2 percent of that in tax (Collins and Pizzigati, 2008).
[27] Another aspect of importance is who decides questions of the redistribution of tax monies. Baiochi (2006) discusses the participatory budgeting process in Porto Alegre, Brasil, and Fox (2009) speaks of the challenges of this kind of citizen participation.
[28] At this time, the College of Public and Community Service (www.cpcs.umb.edu) had a competency based curriculum evaluation instead of grades. Students demonstrated competencies which included a rationale, criteria and standards. They learned new materials in classes or through other educational experiences. If our adult students already had some of the competencies that they needed for their program of study, they had various options to demonstrate their knowledge through what we call prior learning, sometimes supplemented by independent study. This, of course, is labor intensive, and did not fit with a narrow cost-benefit model of higher education. And, as of the Spring 2010 term, the college has been forced to revert to a grade system. We are hoping to also maintain our narrative evaluation.
[29] For a detailed critique of a current popular ranking system of higher educational institutions -the U.S. News and World Report’s annual “Best Colleges” guide, see Gladwell (2011).
[30] This work might parallel the work first produced by the United Nations in 1990, led by economist Mahbub ul Haq, on the measurement of human development. In the foreword to the first American human development report (Burd-Sharpes, Lewis, and Martins, 2008), Amartya Sen asks: “Why has there been such a long tradition of insisting on seeing human progress in terms of alienated variables distant from human lives, like GNP (Gross National Product) which at best relate indirectly and imperfectly to human lives and freedoms?...We have to judge the success of a society, including its economy, not just in terms of national wealth or the ubiquitous GNP, but in terms of the freedoms and capabilities that people enjoy to live as they would value living.” (p. xi)
[31] Greer (2009) reports that the current version is at
http://www.cde.ca.gov/ci/ma/cf/documents/mathfrwkcomplete.pdf, and that, “interestingly, they have changed their discussion somewhat (dare I think they saw what we wrote?)” The current version’s discussion of this problem:
It should be pointed out, however, that the built-in uncertainty and indeterminacy of step 1—which can lead to the setting up of several distinct equations and hence several distinct solutions—has led to the view of mathematics as an imprecise discipline in which a problem may have more than one correct answer. This lack of understanding of the sharp distinction between step 1 and step 2 has had the deleterious effect of downgrading the importance of obtaining a single correct answer and jettisoning the inherent precision of mathematics. As a result the rigor and precision needed for step 2 have been vigorously questioned. Such a misconception of mathematics would never have materialized had the process of transcription been better understood. This level of rigor and precision is embedded in the standards and is essential so that all students can develop mathematically to the level required in the Mathematics Content Standards.
|
|